Monitoring continuity of essential health services during the COVID-19 Pandemic
As countries respond to the COVID-19 pandemic, health systems face the additional burden of maintaining continuity in essential health services. Disruptions in these services can trap countries with fragile health systems in a protracted public health crisis. A meta-analysis of the 2013-2016 West African Ebola outbreak, for example, found an 18% decline in the utilization of healthcare.[i] Lapses in vaccination in the three most-affected countries resulted in an elevated incidence of measles persisting for two years after the outbreak.[ii] These effects are not isolated – disruptions in delivery of health services have been recorded for other services and during other pandemics.[iii],[iv] Declines in the delivery of essential services can threaten global progress towards reducing maternal and child mortality and otherwise impair population health.
The forces driving changes in the delivery of essential services are complex. On the supply-side, the capacity to deliver health services may be impaired by resource reallocation towards pandemic response, an overburdened health workforce, and/or strained supply chains. On the demand-side, populations may avoid health facilities due to fear of exposure, lockdown policies can affect mobility and ability to reach facilities, and financial pressures can reduce the ability to pay for medical services.
The Global Financing Facility for Women, Children and Adolescents (GFF) is supporting countries to monitor the continuity of essential health services. Identifying which services are disrupted, quantifying the level of disruption, and matching these estimates with knowledge of the local context will better inform the public health response. Synthesizing this knowledge across multiple countries may identify common challenges that, at the least, will support the design of preparedness investments for the next crisis.
As part of this effort, GFF, in collaboration with the World Bank’s Development Research Group (DECRG), helps countries to monitor service delivery levels using their own administrative data. These data are reported in Health Management Information Systems (HMIS), typically self-reported by health facilities, which tally the number of services delivered each month. HMIS systems are a core component of the health information system, and thus have several advantages. HMIS systems are available for most countries on the common DHIS2 platform, allowing for cross-country comparisons. HMIS systems cover most facilities in each country, and importantly, include monthly data that predate the pandemic. This allows comparisons of trends in reported services both before and during the pandemic. The use of HMIS data therefore allows for proactive monitoring, without reliance on surveys, and provides a quantitative data point to complement subjective assessments of service disruptions.
HMIS data, however, can have certain inferential limitations. First, there may be gaps in information related to a specific geography or a specific aspect of the health system. For example, private facilities may not be under a legal mandate to report to the HMIS system, and hospitals may report using a different system. This implies that the analysis would only provide a partial picture of changes to service provision. Second, data quality can vary across and within countries. The data may include reporting errors and verification, and cleaning efforts depend on the use of the data by different programs in each country. Lastly, the pandemic can directly affect the reporting by health facilities under strain. Changes in reporting might be confounded with actual changes in the number of services provided.
To better address the HMIS limitations, we clean and process the data before analysis. Facility-level data are downloaded from HMIS systems for the period starting from January 2018 up to the most recent month available. We look closely at two elements of data quality: data completeness and outlier values. We define completeness for each month as the proportion of facilities that reported a non-missing number, out of all facilities which have ever submitted a complete report during the period under analysis. Depending on the level of other services provided and yearly trends, we evaluate whether a zero-report should be treated as a missing value. The resulting completeness trends are reviewed over time, by subnational units, and between types of facilities to identify any trend breaks in missing data that may affect results. An important concern is to identify any substantial change in these trends since the start of the pandemic (defined in this analysis as of March 2020 for all countries), as we don’t wish to confound changes in services since the start of the epidemic with changes in reporting about the services. It’s possible that countries with declining completeness during the pandemic may not have reliable information and therefore supplement an analysis of this nature with other sources of more complete data. This has not been the case for most countries. For example, the completeness of data for the number of outpatient consultations for children <5 years of age in Liberia is consistently above 85% between January 2018 and July 2020.
Since the facility-reported HMIS data are often hand-tabulated, outliers are expected. Despite the existing information verification and validation activities, the nearly contemporaneous use of HMIS data during a crisis results in some reports which have not been fully vetted. We identify likely erroneous reported numbers by reviewing the month-to-month percent change for each facility and the overall distribution for each month across all facilities. Identified outliers are replaced with the median value for that facility. These data quality reports are then reviewed by Monitoring & Evaluation staff in each country, who advise whether potential problems in data quality resulted instead from changes in indicator definition or data collection practices within the country.
To assess disruptions to service provision, we first visualize the monthly reported data. This descriptive analysis is restricted to facilities that consistently report utilization for each month since January 2018 because we don’t want changes in utilization rates to be confounded with possible changes in the composition of reporting facilities. The figure below shows, as one example, the total number of reported outpatient consultations for children under 5 in Liberia. While there is a total of 765 facilities reporting into the country’s health management information system, only 352 facilities consistently report this indicator. The graph shows the total number of consultations reported in the period between March and May 2020 is lower than the numbers reported in the same months in 2019. However, the rates reported in 2019 are lower than those reported in 2018, implying an overall declining trend. The data from 2018 and 2019 also suggests seasonal patterns by which the number of consultations is higher in April-May and in October relative to the other calendar months.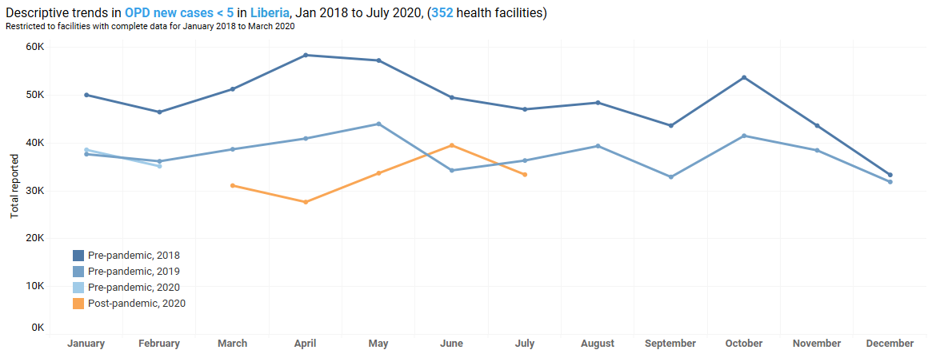 Second, we test if the rates reported since March 2020 are significantly lower than those reported in the same period in 2019. In the case of under-5 outpatient consultations in Liberia, we have data up until July 2020. For this analysis, we restrict the sample to facilities that consistently reported in March-July 2019 and March-July 2020. This leaves us with 609 facilities. Among these facilities, the number of consultations reported in March-July 2020 is lower by 16 percent than the number reported in the same calendar months in 2019. Applying the Wilcoxon rank-sum test, we find the difference to be statistically significant (p-value<0.001).
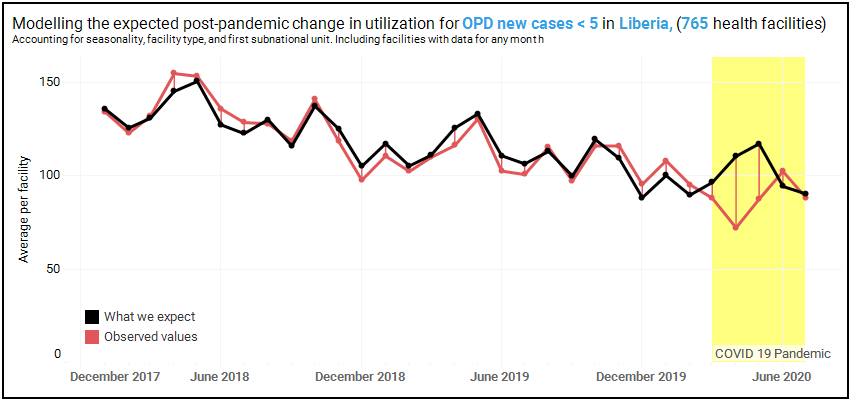
Finally, we use the data from January 2018 to February 2020 to predict what utilization rates in March-July 2020 would have been in the absence of the COVID-19 pandemic. To do this, we specify a regression model that accounts for overall trend, seasonality, region, and facility type. The analysis relies on the assumption that the flexibly modeled trends observed before March 2020 would have persisted in the absence of the pandemic. For this analysis, we use any data from facilities that report at least once into the HMIS. Returning to the example of under-5 outpatient consultations in Liberia, we employ data reported by 765 facilities.
The figure below portrays the modeling exercise. The red line represents average monthly number of consultations reported by the facilities. The black line represents the number of consultations predicted by the estimated model. The first thing to note is that for the pre-COVID period, the two lines are very close, suggesting a close fit between the model and reported data for this period. However, for the months of April and May 2020, there is a gap between the two lines. Relative to the model predictions for the no-COVID scenario, the actual reported number of consultations is lower by 35% in April and by 25% in May. For both months, the estimated reduction is statistically significant at the 1% level. For the month of June, the actual reported rates are not significantly different than the predicted rates.
So far, we have analyzed data reported by more than 63,000 facilities in 10 countries. While the monitoring is continuous, the analysis of data through June 2020 include the following findings:
- Childhood vaccination was the most disrupted service among the countries studied, with a significant drop in the number of children given the third dose of Pentavalent vaccine in Liberia (31% drop), Nigeria (13%) and Afghanistan (11%). This is a particularly worrisome finding given the proven role of vaccination in preventing a wide range of common childhood killers.
- The number of outpatient consultations fell for at least one month in all countries where this was monitored. As portrayed in the example above of under-5 outpatient consultations in Liberia, some of the reductions in utilization improved in June.
- There are no generalized changes in maternal health services, although disruptions were detected in several countries. For example, the number of women who attended all four recommended medical visits during pregnancy dropped in Liberia (18% in April), and the initiation of women seeking medical care during pregnancy fell in Nigeria (16% in April). These disruptions put women in greater risk of complications or death from pregnancy.
- Disruptions vary across indicators and countries. For example, in Nigeria, there was a more than 10% decrease in April and in May a 15% decrease in family planning services, and a 6% decrease in women delivering babies at health facilities. However, there are mixed results across indicators in most countries. For example, in Afghanistan, while there were no significant changes in postnatal consultations as a result of the crisis, there was a 14% drop in outpatient consultations. Some health service utilization levels appear to have improved again in June but there was no evidence of catch-up.
These results should be interpreted with care, and with knowledge of the inherent limitations of HMIS data described above. We continuously refine the analysis through consultation with countries and review of the analytic approaches. Our findings support the growing body of evidence on service delivery disruption due to the COVID-19 pandemic. Additional investments aimed at increasing the quality and reliability of HMIS data will allow analysis such as this to become a routine country monitoring activity.
To better understand the diversity of service disruption across countries, the GFF is supporting two additional activities. The first effort is a repeated rapid health facility phone survey, which will enhance the information beyond what is routinely reported into the administrative databases. For example, the surveys will collect information on disruptions in supply chains, perceived impacts on health providers, and modifications in service delivery made in response to the pandemic. Second, the GFF is collaborating with the World Bank’s Poverty Global Practice and partner countries to triangulate the data reported by the health facilities with data from high-frequency household phone surveys. Such triangulation can provide an opportunity to understand some of the reasons behind low utilization of health services. For example, early results from Nigeria show that 34% of respondents needed health service in April/May. Of those, about 26% said they could not access the services they needed. Among those, a majority – 55% - said they couldn’t do so because they couldn’t afford to pay, while a quarter said this was due to lockdowns and movement restrictions imposed to control the pandemic.[v]
The GFF, with support of the DECRG, is offering this support to all its 36 low and lower-middle-income partner countries. We welcome all GFF countries to partner with this monitoring endeavor to use data to drive policy decisions and targeted strategies within country, as well as to enhance learning across countries.
[ii] Masresha, B. G., Luce Jr, R., Weldegebriel, G., Katsande, R., Gasasira, A., & Mihigo, R. (2020). The impact of a prolonged ebola outbreak on measles elimination activities in Guinea, Liberia and Sierra Leone, 2014-2015. The Pan African Medical Journal, 35(Suppl 1).
[iii] Sochas, L., Channon, A. A., & Nam, S. (2017). Counting indirect crisis-related deaths in the context of a low-resilience health system: the case of maternal and neonatal health during the Ebola epidemic in Sierra Leone. Health policy and planning, 32(suppl_3), iii32-iii39.
[iv] Chang, H. J., Huang, N., Lee, C. H., Hsu, Y. J., Hsieh, C. J., & Chou, Y. J. (2004). The impact of the SARS epidemic on the utilization of medical services: SARS and the fear of SARS. American journal of public health, 94(4), 562-564.
[v] More information on the surveys can be found here. More information on the Nigeria survey can be found here.